Etalon Fringe Image: Determining the Center
The following describes an approach to process images produced for observation of the Zeeman Effect by a Fabry-Perot etalon. Full code available at the Lothilius github repo. Full research paper can be found on the Analyzing the Fine Structure of Mercury Through the Zeeman Effect post.
Determining the center of the fringe pattern is done through the use of the "hough circle" function in the Scikit Image processing package. The function uses the output of the Canny edge detection filter to trace out the edges of the first set of rings.
- import skimage as ski
- image_proc = ski.filter.canny(image_stripped, sigma=4, low_threshold=0, high_threshold=7)
- hough_radii = np.arange(350, 425, 5)
- hough_res = ski.hough_circle(image_proc, hough_radii)
- ...
- for radius, h in zip(hough_radii, hough_res):
- # For each radius, extract two circles
- peaks = peak_local_max(h, num_peaks=2)
- centers.extend(peaks)
- accums.extend(h[peaks[:, 0], peaks[:, 1]])
- radii.extend([radius, radius])
- ...
- # Draw the most prominent 15 circles
- for idx in np.argsort(accums)[::-1][:15]:
- center_x, center_y = centers[idx]
- radius = radii[idx]
- center_array.append([center_x, center_y])
- cx, cy = circle_perimeter(center_y, center_x, radius)
- image[cy, cx] = (220, 0, 0)
The first section of the code uses the "hough circle" function to detect the potential circle components in the image of radius between 350 and 435. The second section of the code uses the "peak local max" to determine the location of the circles. The third section of the code is used for re-packageing the circle information to an image array which can be printed out as an image such as the detection of center image. Also, in section 3 the centers of the detected circles is gathered for later determining the average center point. Because determining the center of the fringe pattern is time intensive, a method to better narrow the radius range on line 3 could greatly improve efficiency. The radius range on line 3 was determined by manual estimation for the current implementation.
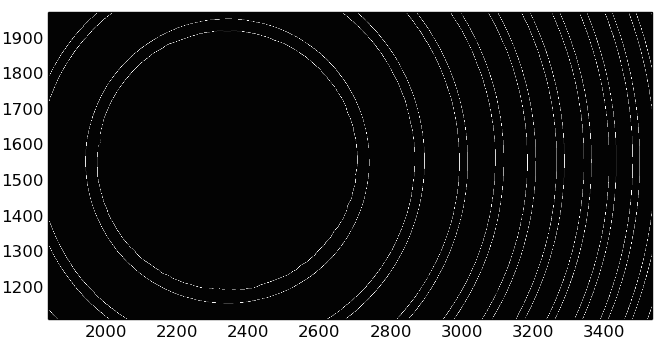
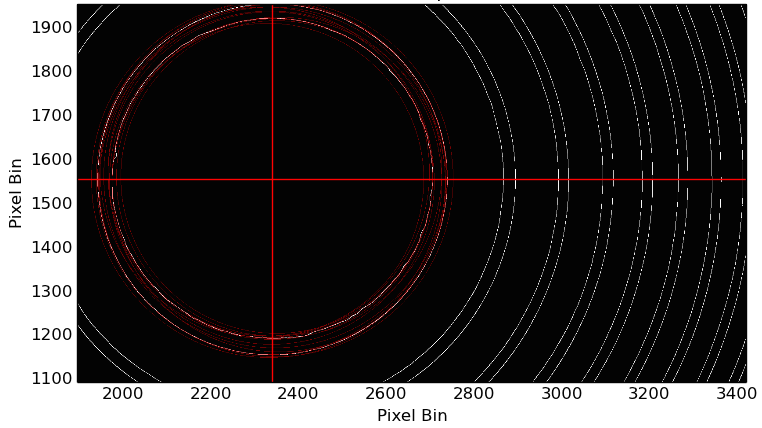
The top image is section of the Canny filter image. The white lines are the detected edges of one pixel in thickness. Because of the the narrow thickness not all pixels of the edges are printable on the image, however, if we were to zoom in on the image we can verify the detected edges are continues. Similarly the bottom image does not display all pixels of the Canny detected edges or of the detected circles in red.
Leave a Reply