Fabry-Perot Etalon Image: Peak Radii Determination
The following describes an approach to process images produced for observation of the Zeeman Effect by a Fabry-Perot etalon. Experimental setup is similar to that described by PHYWE's youtube video. Full code available at the Lothilius github repo. Full research paper can be found on the Analyzing the Fine Structure of Mercury Through the Zeeman Effect post.
In Figure 12 the images show a comparison of the zero amps image with the 3.4 amps image. As can be seen in the zero amps image the peak intensities are much more clear than that of the 3.4 amps. This clarity in peaks is the primary the reason to use the zero amps image as a way to establish a range for each peak detection. Because of the sharp peaks present in the zero amps image, the Canny function has a greater chance at detecting the edges of the peaks and provide two pieces of useful information. The first is a clear representation of the fringe pattern, which can be used to determine the center of the fringes, and second, it establishes boundaries for which to look for intensity peak locations. The center determination is discussed in Etalon Fringe Image: Determining the Center.
- import skimage as ski
- image_stripped = rgb2gray(image_stripped)
- image_proc = ski.filter.canny(image_stripped, sigma=4, low_threshold=0, high_threshold=7)
In python the Scikit Image package must be imported before use of Canny filter. Line 1 converts the filtered image to a grey scale image. Line 3 provides the use of the Canny filter on the grey scale image ”image stripped”. Beside the variable name of the image three parameters are passed to the Canny filter; sigma, low and high hysteresis thresholds. The Canny filter is made of two sub-filters, first performing Gaussian smoothing, then Sobel edge detection.
The sigma parameter provides a blurring parameter in terms of standard deviations of the pixel. The Gaussian filter serves to reduce noise in the image and there by reducing the possibility of false positive edge detection. The Sobel edge detection provides the actual detection of the edges of the fringes by calculating a gradient and its direction for each pixel. Once the Sobel edge detection is complete the Canny filter uses the low and high hysteresis thresholds as a guideline to label each pixel as an edge. The resulting print out of the ”image proc” variable provides an array of the same dimensions as the initial image, however, in place of the intensity values, the values of each pixel will be a boolean providing wether the pixel in the original image is an edge or not. See the print out of the zero amps (therefor zero Tesla) image.
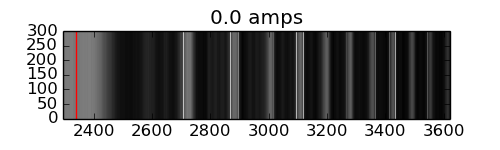
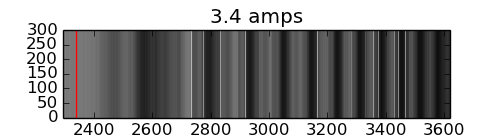
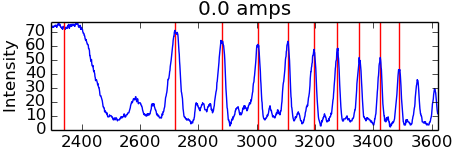
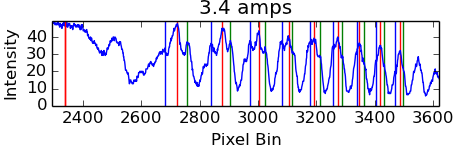
Figure 12: The top images display the right half of the center cross sections duplicated enough to show the intensity pattern. White lines are the result of the Canny edge detection function. The bottom two plots display the intensities for the same sections. Green lines are the the intensity peaks of the  =-1 transition, and blue lines are for the =1 transition. The red line at the left of all the images is the center of the rings along the x axis and each following red line are that of the =0 transition.
Leave a Reply